Around here
Around Little Maitland River
Public land: USGS PAD-US
About this river
Little Maitland River is a 35.3 mile river. Streamflow is measured at the Water Survey of Canada gauge Little Maitland River at Bluevale (site 02FE007). Reach geometry comes from Natural Resources Canada's National Hydro Network.
Typical flow by month
1967 to 2024
Little Maitland River typically runs highest in March, at a median 290 cfs, and lowest in September, at 16 cfs. The highest flow on record for any single day is 6,074 cfs, in 1977.
Show the numbers
| Month | Typical (cfs) | Usual range (cfs) |
|---|---|---|
| January | 120 | 82 to 232 |
| February | 109 | 72 to 203 |
| March | 290 | 136 to 540 |
| April | 243 | 154 to 417 |
| May | 105 | 67 to 166 |
| June | 46 | 33 to 76 |
| July | 26 | 17 to 42 |
| August | 18 | 12 to 31 |
| September | 16 | 9.5 to 31 |
| October | 43 | 23 to 126 |
| November | 95 | 51 to 229 |
| December | 140 | 85 to 234 |
Typical is the median of each month’s daily median values, and the usual range runs from the median 25th to the median 75th percentile, across about 53 years of record. Statistics published by the US Geological Survey for Little Maitland River at Bluevale (site 02FE007). Conditions on any given day can fall well outside the usual range. Check the current reading before you go.
Made to print
Put Little Maitland River on your wall
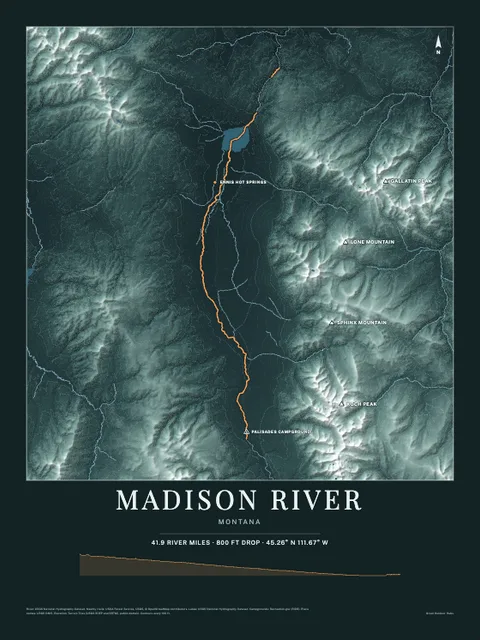
This river section as an art print, drawn over the real terrain with its miles, plus the trails, roads and peaks around it. Pick the colors and the size, and see the finished print before you buy. From $39, shipping included.
Embed this gauge on your site
Paste this snippet anywhere, an outfitter page, a club site, a trip report, to show Little Maitland River's live streamflow, water level and 7-day trend. It reads the USGS gauge directly, updates itself, and links back here.
See every free widget you can put on your site, including live conditions and a 7 day forecast.