Wabash River in Indiana
Around here
Around Wabash River
Public land: USGS PAD-US
About this river
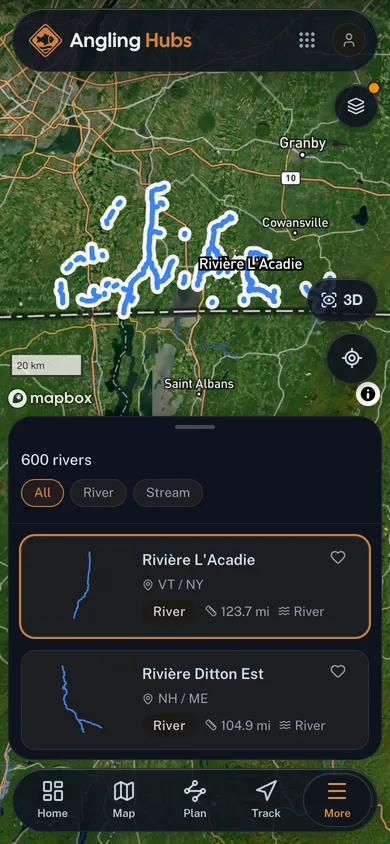
Wabash River is a 62.1 mile river. Streamflow is measured at the USGS gauge Wabash River at Logansport, IN (site 03329000). The National Hydrography Dataset places it at stream order 9. Reach geometry comes from the USGS National Hydrography Dataset.
Typical flow by month
1924 to 2026
Wabash River typically runs highest in March, at a median 4,470 cfs, and lowest in September, at 647 cfs. The highest flow on record for any single day is 84,700 cfs, in 1943.
Show the numbers
| Month | Typical (cfs) | Usual range (cfs) |
|---|---|---|
| January | 2,140 | 950 to 6,730 |
| February | 2,450 | 1,280 to 7,060 |
| March | 4,470 | 2,210 to 9,690 |
| April | 3,490 | 1,730 to 8,230 |
| May | 2,180 | 1,280 to 5,450 |
| June | 1,725 | 1,045 to 4,440 |
| July | 964 | 615 to 2,160 |
| August | 680 | 472 to 1,190 |
| September | 647 | 401 to 1,135 |
| October | 1,080 | 519 to 1,670 |
| November | 1,550 | 780 to 2,445 |
| December | 1,550 | 728 to 4,420 |
Typical is the median of each month’s daily median values, and the usual range runs from the median 25th to the median 75th percentile, across about 103 years of record. Statistics published by the US Geological Survey for Wabash River at Logansport, IN (site 03329000). Conditions on any given day can fall well outside the usual range. Check the current reading before you go.
Boat access nearby
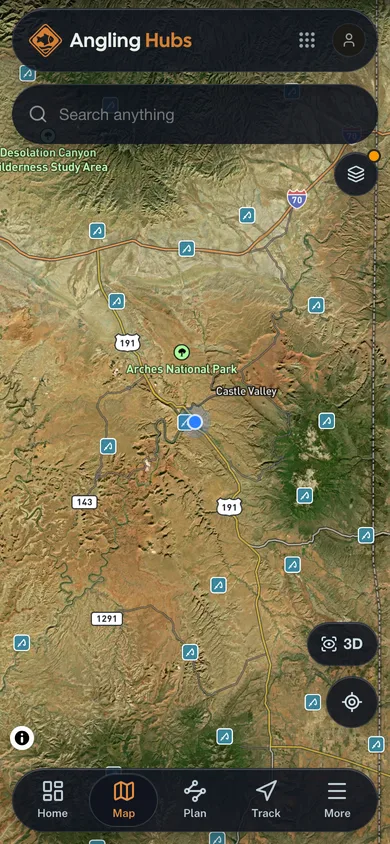
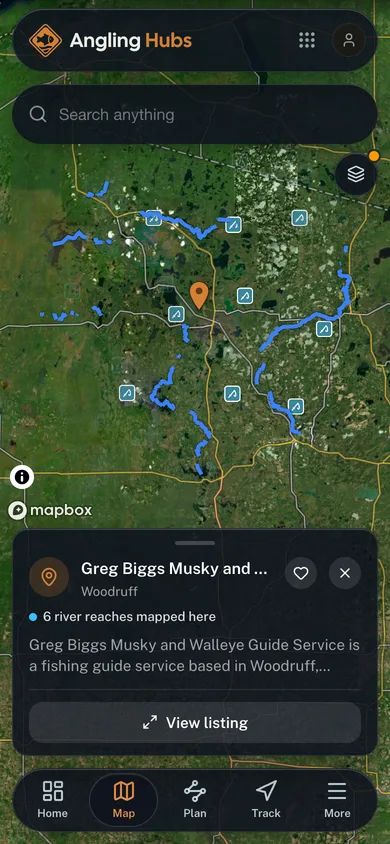
8 mapped launches sit in the mapped area of Wabash River, all of them public access. Ramp data comes from the USGS national boat-ramp inventory.
- Hardin RidgeMonroe LakePublic
- Allens CreekMonroe LakePublic
- Turtle Creek ReservoirTurtle Creek ReservoirPublic
- Goose Pond Fish & Wildlife Area - MeromWabash RiverPublic
- CutrightMonroe LakePublic
- Moores CreekMonroe LakePublic
- Pine Grove State Recreation AreaMonroe LakePublic
- Kraemer Memorial ParkWabash RiverPublic
Embed this gauge on your site
Paste this snippet anywhere, an outfitter page, a club site, a trip report, to show Wabash River's live streamflow, water level and 7-day trend. It reads the USGS gauge directly, updates itself, and links back here.
See every free widget you can put on your site, including live conditions and a 7 day forecast.