Tide charts are one of the most underutilized tools in saltwater fishing. Many anglers show up at their favorite estuary or flat without checking the tide, only to find the water dropping or the fish already fed and inactive. Understanding how to read a tide chart transforms you from a hopeful caster to a strategist. The rise and fall of water affects everything: where fish position themselves, when they feed, how current flows through channels, and which structures become productive. Whether you're chasing redfish in coastal Louisiana, stripers in New England estuaries, or bonefish on Atlantic flats, tides dictate the rhythm of the day. A small investment in learning to read tide charts reliably improves your success rate across every saltwater fishery.
Understanding Tidal Movements
Tides are the gravitational dance between the moon, sun, and Earth's oceans. The moon's gravity pulls on Earth's water bodies, creating a bulge on the side facing the moon and another on the opposite side. As Earth rotates, different regions pass through these bulges, experiencing high tides roughly every 12 hours and 25 minutes. The sun also influences tides, though its effect is weaker than the moon's. When the sun and moon align, new and full moon, their gravitational forces combine to create extreme high tides and very low tides called spring tides. When the sun and moon are at right angles to Earth during quarter moons, their effects partially cancel, producing smaller fluctuations called neap tides.
The vertical distance between high and low tide is called the tidal range. In saltwater fisheries, this range varies dramatically by location. Some bays experience only 2–3 feet of change, while places like the Bay of Fundy see 40-foot swings. Understanding your local tidal range is critical, a 2-foot change in a narrow creek can dramatically alter habitat, while the same change in a wide bay may barely shift the fishing. Check NOAA's tide prediction page for your specific location to see historical tidal ranges and plan around spring and neap cycles. Areas with larger tidal ranges typically offer more pronounced fishing windows, while smaller ranges create subtler but still significant feeding periods.
Reading a Tide Chart: Breaking Down the Lines
A tide chart displays time on the horizontal axis and water height on the vertical axis. The line running across the chart represents predicted water level throughout the day. High tides appear as peaks, and low tides as valleys. The exact times and heights are printed below the chart, this is critical information. For example, a chart might show "High Tide: 8:47 AM, 5.2 feet" and "Low Tide: 3:15 PM, 0.8 feet." The difference between these numbers (4.4 feet in this example) is your tidal range for that day. Mark these times on your phone or write them down before you fish. The flatter parts of the line, the peaks and troughs, represent slack water: the brief periods when current is minimal, occurring at and just after the high and low tides (the turn of the tide). Maximum current runs at the steepest part of the curve, roughly halfway between the high and the low.
That steepest, mid-tide part of the curve is where water moves fastest through channels and around structures. Current strength correlates directly with tidal range, larger ranges generate stronger currents. Most charts show time increments in hourly marks so you can estimate water level at any point during your day. Modern apps like NOAA's tides website or fishing-specific applications let you zoom to five-minute increments, which is valuable if you're timing a specific window. The prediction accuracy depends on your local geography; charts are most accurate within a few miles of the tide station, and may shift by 15–30 minutes if you're fishing far from the reference station.
How Tides Affect Fish Behavior and Location
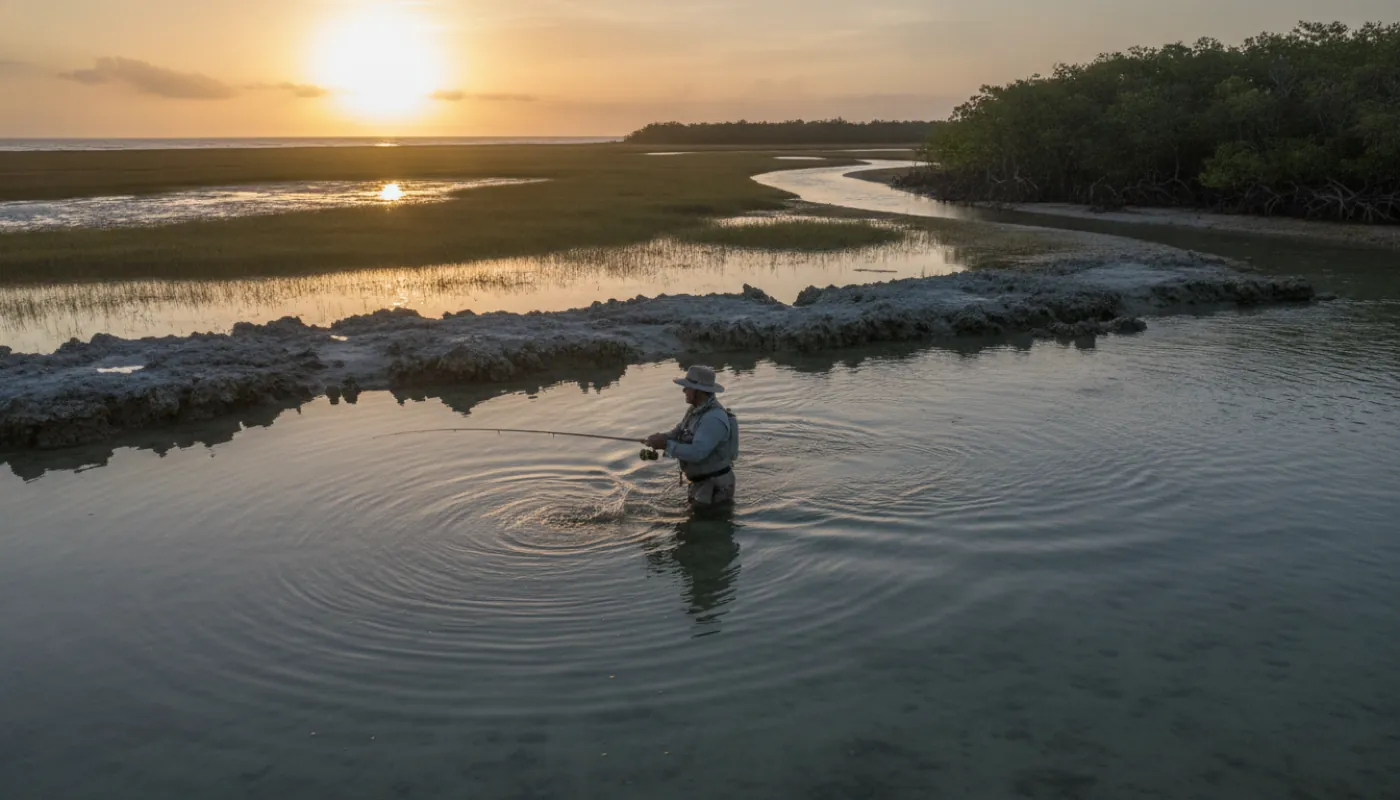
Fish respond predictably to tidal movement because it governs feeding opportunity and physical positioning. During incoming tide, water floods into shallow bays and onto grass flats, pushing baitfish into new areas and triggering aggressive feeding. Many saltwater species (redfish, stripers, permit, bonefish), feed most actively during the first two to three hours of an incoming tide, when water movement is moderate and rising. As tide continues toward slack at high tide, feeding often slows; fish become less aggressive and may suspend in deeper holes to wait for the next current phase.
When the tide begins falling, a second feeding window typically opens, though it's usually less intense than the incoming bite. Slack water, the 30–60 minute period around high and low tide when current nearly stops, is often avoided by anglers but it's excellent for sight fishing and finesse presentations on flats. Without current pushing fish around, they hold position longer, and you can spot individual fish more easily. Slack tide is usually slower for blind casting because fish aren't being funneled by current, but the advantage for sight fishing is significant. Tide rips form where fast current meets structure, creating lines of churning water rich with baitfish. Understanding rip lines requires reading how tidal current interacts with your specific water: oyster bars, channel breaks, and points all redirect current and concentrate fish in predictable zones.
Seasonal and Geographic Variations
Tide ranges shift with the seasons and geography. Coastal areas at high latitude (Maine, Alaska), experience larger seasonal swings in tidal range than southern fisheries. Spring typically brings the most extreme spring tides in many regions, while fall ranges may be more moderate. Cold-water species like stripers in New England eat aggressively during active tide windows in spring and fall, but summer heat can flatten the bite regardless of tide condition, though early morning and evening tidal windows still improve your odds. Tropical and subtropical fisheries have more consistent year-round tidal patterns, but seasonal current and wind changes still matter significantly.
Geographic position relative to the coast affects how tide manifests. Barrier islands and protected bays experience different tidal behavior than exposed ocean shorelines. Inlets funnel current and create violent rips; shallow back-country creeks show exaggerated water-level changes that become impassable at low tide. Before fishing a new area, check whether the tide station you're consulting is upstream or downstream from your target, and whether local dams or restrictions affect water movement. Some areas have secondary tides, a slight rise after a low tide before the main incoming, due to geographic quirks. Asking local guides or checking NOAA's secondary station list prevents surprises and failed fishing days.
Using Tides to Plan Your Day
Successful saltwater fishing starts the night before. Pull up the tide chart for your destination, identify high and low tide times, and plan your arrival around the feeding window that matches your target species and location. If you want to fish an incoming tide on a flats fishery, arrive 30–60 minutes before the tide rises; this gives you time to sight-fish the last of low tide shallows and be positioned when fish move shallow to feed. For deeper channel or structure fishing, plan to be on the water during the one to three hours after high or low tide begins moving, when current is strongest.
Bring your tide chart on the water: printed, screenshotted on your phone, or via an app. Check it every hour to confirm your sense of current strength and anticipate the next transition. This habit prevents fishing passively while waiting for a tide that already peaked. If the bite shuts down, it's usually because you've entered slack water or the current direction reversed, the chart confirms this without guesswork. Pay attention to wind and barometric pressure too; these amplify or suppress tidal feeding windows. A strong incoming tide with falling barometer and light wind is ideal. An incoming tide fighting heavy wind or rising barometer may dampen the bite considerably. Over time you'll develop intuition about which tide conditions produce the best fishing in your area.