Most stocking advice comes down to "check your state's schedule." That works if you fish one state. If you fish more than one, or you are deciding where to drive in July, the more useful question is how the states differ from each other.
We hold 179,898 stocking records covering 4,743 named waters, published by four state agencies and normalized into one corpus: Washington Department of Fish and Wildlife, Utah Division of Wildlife Resources, New York State Department of Environmental Conservation, and Montana Fish, Wildlife & Parks. The records run from January 2000 to July 2026, though coverage is not even across that span: the Utah records in this analysis end in December 2024 and New York's in December 2025, so the most recent years rest on Washington and Montana alone. (Utah publishes its 2025 and 2026 stockings as a separate report, which we added to our records on September 23, 2026. The figures here predate it.) This is what they show.
There are two stocking calendars, not one
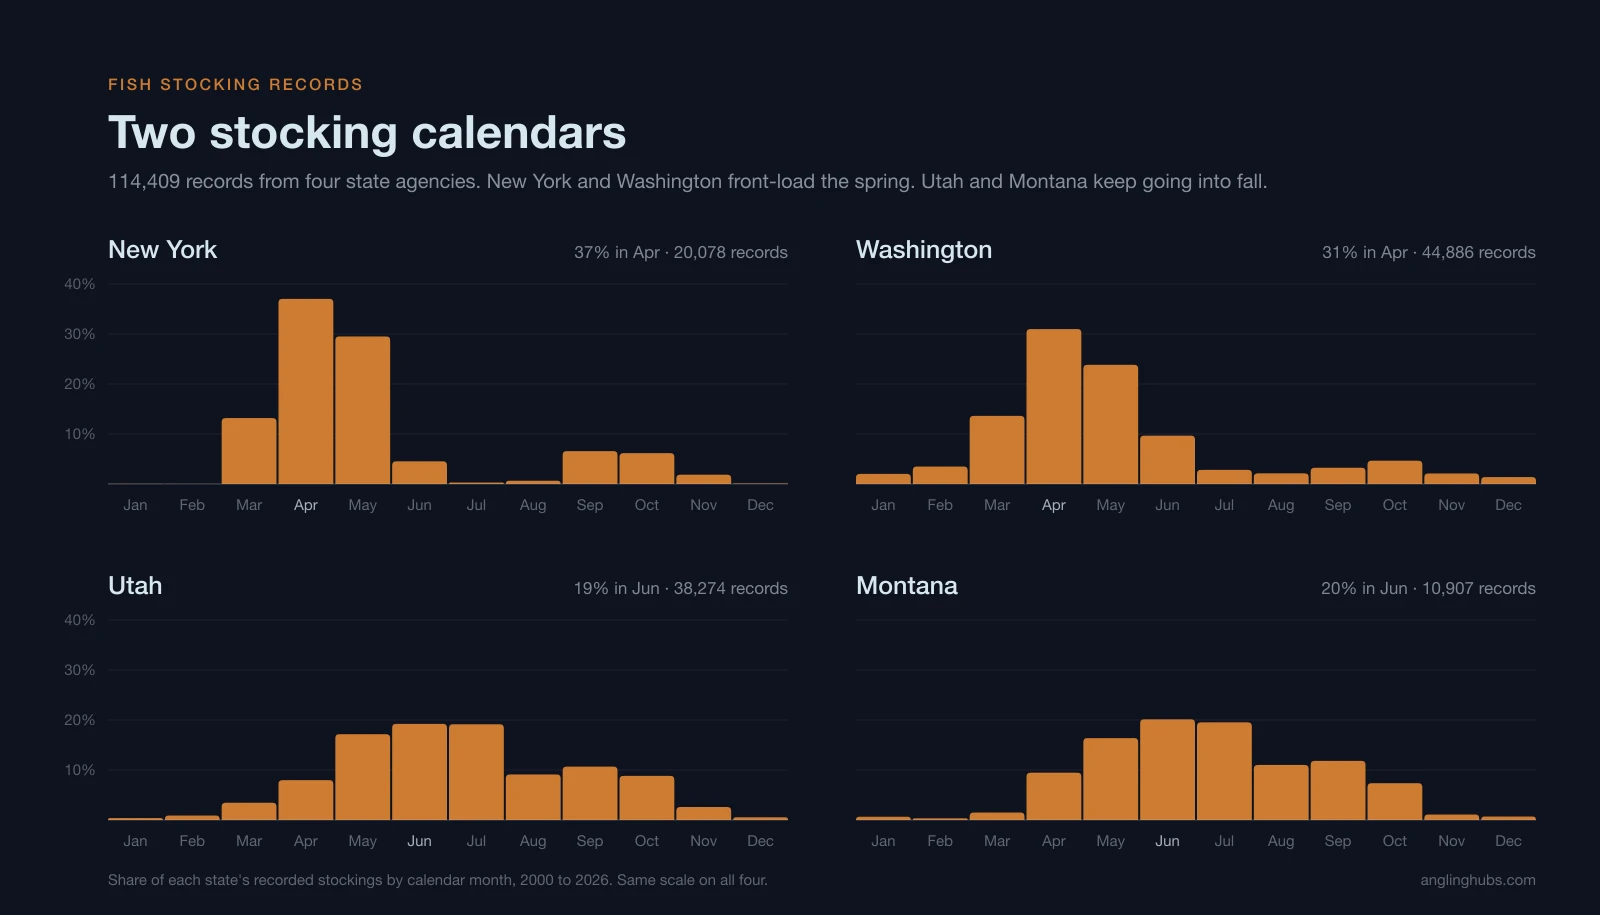
Sort every record by the month it happened and the four states split cleanly into two groups.
| State | Mar | Apr | May | Jun | Jul | Aug | Sep | Oct | Records |
|---|---|---|---|---|---|---|---|---|---|
| New York | 13% | 36% | 28% | 4% | 0% | 1% | 9% | 7% | 30,427 |
| Washington | 13% | 29% | 24% | 10% | 3% | 3% | 4% | 6% | 59,063 |
| Utah | 3% | 8% | 17% | 19% | 19% | 9% | 10% | 8% | 64,306 |
| Montana | 2% | 14% | 21% | 24% | 15% | 8% | 9% | 5% | 26,102 |
New York and Washington are spring-loaded. New York puts 77% of its records into March through May and Washington 66%, and both go quiet by midsummer. Utah and Montana spread their work later: Utah runs 28% in that spring window and Montana 37%, with both still working through September.
The gap is widest in July. New York records essentially no stocking that month. Utah is at its annual peak, tied with June at 19%. Montana has just come off its own peak, which falls in June at 24%.
The pattern holds for catchable-size fish
A monthly split across all records could just be reflecting fry releases, which are timed to hatchery biology rather than to anglers. So we ran it again against catchable-size fish only, meaning anything six inches or longer. That is the fish you have a realistic chance of catching in the weeks after the truck leaves.
| State | Mar | Apr | May | Jun | Jul | Aug | Sep | Oct | Catchable records |
|---|---|---|---|---|---|---|---|---|---|
| New York | 15% | 42% | 32% | 3% | 0% | 1% | 2% | 3% | 24,641 |
| Utah | 4% | 9% | 20% | 20% | 14% | 8% | 8% | 8% | 45,965 |
| Montana | 3% | 15% | 24% | 22% | 10% | 4% | 12% | 7% | 11,171 |
It gets sharper, not softer. New York does 89% of its catchable stocking in March through May and none at all in July. Utah is still putting 8% of its catchable fish in the water in October, a month by which New York is down to 3% and finished for the year.
Montana has a wrinkle worth knowing: September (12%) outruns August (4%). If you are planning a Montana trip around fresh fish, early autumn is a better bet than late summer.
Washington is absent from this second table because WDFW does not publish a length on each release. It has its own section further down, in its own categories.
Counting fish tells you almost nothing
The corpus contains 7.94 billion fish. That number is true and nearly useless, because it counts a 0.3 inch walleye fry the same as a 10 inch rainbow trout.
Split New York's records by the size of what went in the water and the problem is obvious.
| Size band | Share of records | Share of fish | Average size |
|---|---|---|---|
| Fry, under 1 inch | 2% | 97% | 0.24 in |
| Fingerling, 1 to 6 inches | 17% | 2% | 4.03 in |
| Catchable, 6 inches and up | 81% | 1% | 10.00 in |
487 fry releases account for 97% of every fish New York put in the water. The individual releases are enormous: the largest single walleye fry release in the record is 195 million fish, at about a third of an inch each. Meanwhile 24,641 separate catchable-size releases, the ones an angler would actually plan around, add up to about 1% of the fish count.
Utah and Montana are built differently. Utah puts 71% of its records into catchable-size fish, and those account for 47% of its total fish. Montana is the opposite: catchables are 43% of its records but only 3% of its fish, fingerlings are 55% of records and 23% of fish, and a mere 2% of its records are fry that carry 74% of everything Montana puts in the water.
So a state that stocks ten times more fish than another may be stocking far fewer fish you can catch. Compare records, not totals.
The states stock different sized fish
Among the three states that publish a length, the average catchable release lands in a tight band, but the state-wide average does not.
| State | Average across all records | Average catchable release |
|---|---|---|
| Montana | 6.18 in | 10.63 in |
| Utah | 8.12 in | 10.14 in |
| New York | 8.80 in | 10.00 in |
Montana has the smallest overall average and the largest catchables. Both facts come from the same cause: Montana spends most of its records on fingerlings, so the small fish drag the state average down while the comparatively rare catchable release is a genuinely big fish.
One caution on trends. If you pool all four states and plot average size by year, the line climbs from about 7.3 inches in the mid 2000s to 8.3 inches by 2024, which looks like a story about hatcheries growing bigger fish. It is not, and the pooled line misleads at both ends. The single largest jump in the whole series is 2010 to 2011, from 7.66 to 8.37 inches, and that is the year New York joined the corpus stocking much larger fish. The Utah records in this analysis then stop after 2024, so any pooled figure from 2025 onward drops the state that supplies 53% of all the size records we hold. Read the states separately and the movement mostly disappears: Montana averages 6.06 inches across 2000 to 2004 and 5.86 inches across 2020 to 2024, and Utah moves from 8.03 to 8.19 across the same twenty years. Neither is a hatchery story.
Washington, in its own categories
Washington is the second-largest feed in the corpus, after Utah, and it has been sitting out every table above, because WDFW records fish per pound rather than inches. We asked the department whether a length was published somewhere we had missed. It is not, but their Fish Program went to the hatchery staff and sent back the conversion the hatcheries work to, which lets every trout and kokanee release be placed in one of the four categories WDFW already publishes.
| WDFW category | Fish per pound | Published size | Records | Share of records | Share of fish |
|---|---|---|---|---|---|
| Jumbo and brood | 0.1 and under | 14 in and larger | 197 | 1% | under 1% |
| Catchable | 0.1 to 3.0 | 9 to 14 in | 17,398 | 48% | 12% |
| Put, grow and take | 3.0 to 10.0 | 2 to 8 in | 5,054 | 14% | 11% |
| Fry and fingerling | 10.0 to 600 | 2 in and smaller | 13,362 | 37% | 76% |
That covers 36,011 of Washington's 59,063 records. The other 23,052 are Chinook, Coho, Steelhead, Sockeye and Chum, which the trout and kokanee table does not cover, so they are left uncategorized rather than guessed at.
Two things fall out of it, and both repeat what the other states already showed.
The fish count is misleading here too, in the same direction. Fry and fingerling releases are 37% of Washington's categorized records and carry 76% of its fish. Catchables are 48% of the records and 12% of the fish. A reader who ranks Washington by the number of fish it puts in the water is mostly ranking its fry program.
And the spring concentration gets sharper when you look at fish an angler can catch, exactly as it does in New York and Utah. 66% of all Washington records fall in March through May. Restrict it to catchable and jumbo releases and that rises to 72%.
One caution on reading this table against the ones above it. These are agency categories, not measurements. Every Washington number here is a band a hatchery works to, so a release in the catchable row is somewhere between 9 and 14 inches rather than a recorded length. The three other states publish a length per release, and those tables use a 6 inch line to separate catchables. The two cuts are not the same and the tables should not be read against each other.
The 2020 gap
New York stocked 30 walleye events in 2020, a normal number, totaling 57.7 million fish. Every other year in the record runs between 159 million and 246 million. The event count held and the fish count fell by roughly three quarters.
The records say what happened, not why. We are not going to assert a cause from a stocking table.
The most-stocked waters
By count of catchable-size releases across the whole corpus:
| Water | Stocked by | Catchable releases |
|---|---|---|
| Strawberry Reservoir | Utah | 1,675 |
| Deer Creek Reservoir | Utah | 953 |
| Logan River | Utah | 948 |
| Fish Lake | Utah | 873 |
| Otter Creek Reservoir | Utah | 737 |
| Willow Park Pond | Utah | 692 |
| Canyon Ferry Lake | Montana | 676 |
Strawberry Reservoir alone carries 1,675 catchable releases and 31.6 million fish, which is 76% more than the next water on the list.
Utah takes six of the top seven. That is a property of how the states publish rather than of the fisheries: Utah reports at the individual release and has done so since 1979, while New York reports to the month and Washington to a program, so a Utah water accumulates more separately counted releases for the same amount of work.
What this data is and is not
The records are published by four state agencies and assembled here without modification. Some limits worth stating plainly:
- Four states, not the country. Washington, Utah, New York and Montana. We also hold a California feed of 2,006 records, which sits outside the 179,898 counted here because it is a rolling twelve month window carrying neither fish counts nor sizes, so it cannot enter any table above. Nothing for the other 45 states. Nothing here describes national practice.
- Washington's records carry no per release length, so it is categorized rather than measured. WDFW reports fish per pound rather than inches. Its 2026 Statewide Trout and Kokanee Stocking Plan publishes four stocking categories and typical sizes for them, including catchables averaging about 11 inches on opening day and jumbos over 14 inches, but it does not publish the fish per pound range behind each category. WDFW's Fish Program supplied those ranges on request in September 2026, and they are what the Washington table uses. Every Washington figure in that table is therefore a band the hatcheries work to, not a measured length, and it is a different cut from the 6 inch line the other three states are split on. Washington's salmon and steelhead records fall outside the trout and kokanee table and stay uncategorized.
- New York reports month precision only. Its dates are reliable to the month, which is all the monthly tables need, and it is excluded from anything finer.
- Species names are not standardized between states. "Rainbow trout", "Rainbow" and "Rainbow Trout" arrive as three separate values, one per agency. We map all of them onto a single species before counting. The corpus carries 97 raw agency names, which resolve to 66 species plus five entries that are not species at all ("Trout", "Panfish", "Crappie" and the like) and are left out rather than guessed at. Steelhead is kept separate from rainbow trout, and the named cutthroat subspecies are kept separate from generic cutthroat, because an angler would not accept one as the other.
- We group by the agency, the state reports group by the water. Everything above counts a record against the agency that published it. The linked state reports count it against the state the water sits in, so a handful of border waters land differently and the per-state totals there will not match this page exactly. Both add up to the same 179,898 records.
- Stocking does not mean fish are present. A truck came on a date. What survived, moved or got caught afterwards is not in any of these records.
Where to look next
Every state above has its own report with the underlying records, including species, hatchery where the state reports one, and the most recent events:
Each species in those reports has its own page, with the same month breakdown narrowed to one fish and the full list of waters it goes into. The ones this piece leans on:
- New York walleye, the fry program behind 97% of the state's fish count
- Utah rainbow trout and Washington rainbow trout, the same species on two different calendars
- Washington chinook salmon, stocked by the hundred-million at roughly three inches
- Montana westslope cutthroat trout, a subspecies stocked across 451 waters
To go the other direction and start from water rather than state, browse fishing spots by state and county. Waters we hold stocking records for show their full history on the spot page.